

MeshOS · Energy management system
Stay under your grid contract and know what every product costs in energy
Your energy bill shows a total and a peak charge. It does not say which line caused the peak on Tuesday at 14:00, or what one batch cost in kilowatt-hours. The energy management system in MeshOS measures every main consumer, forecasts tomorrow's load, plans your battery on day-ahead prices and shaves a live peak before it lands on the bill. Start with the main meter and your worst peak.
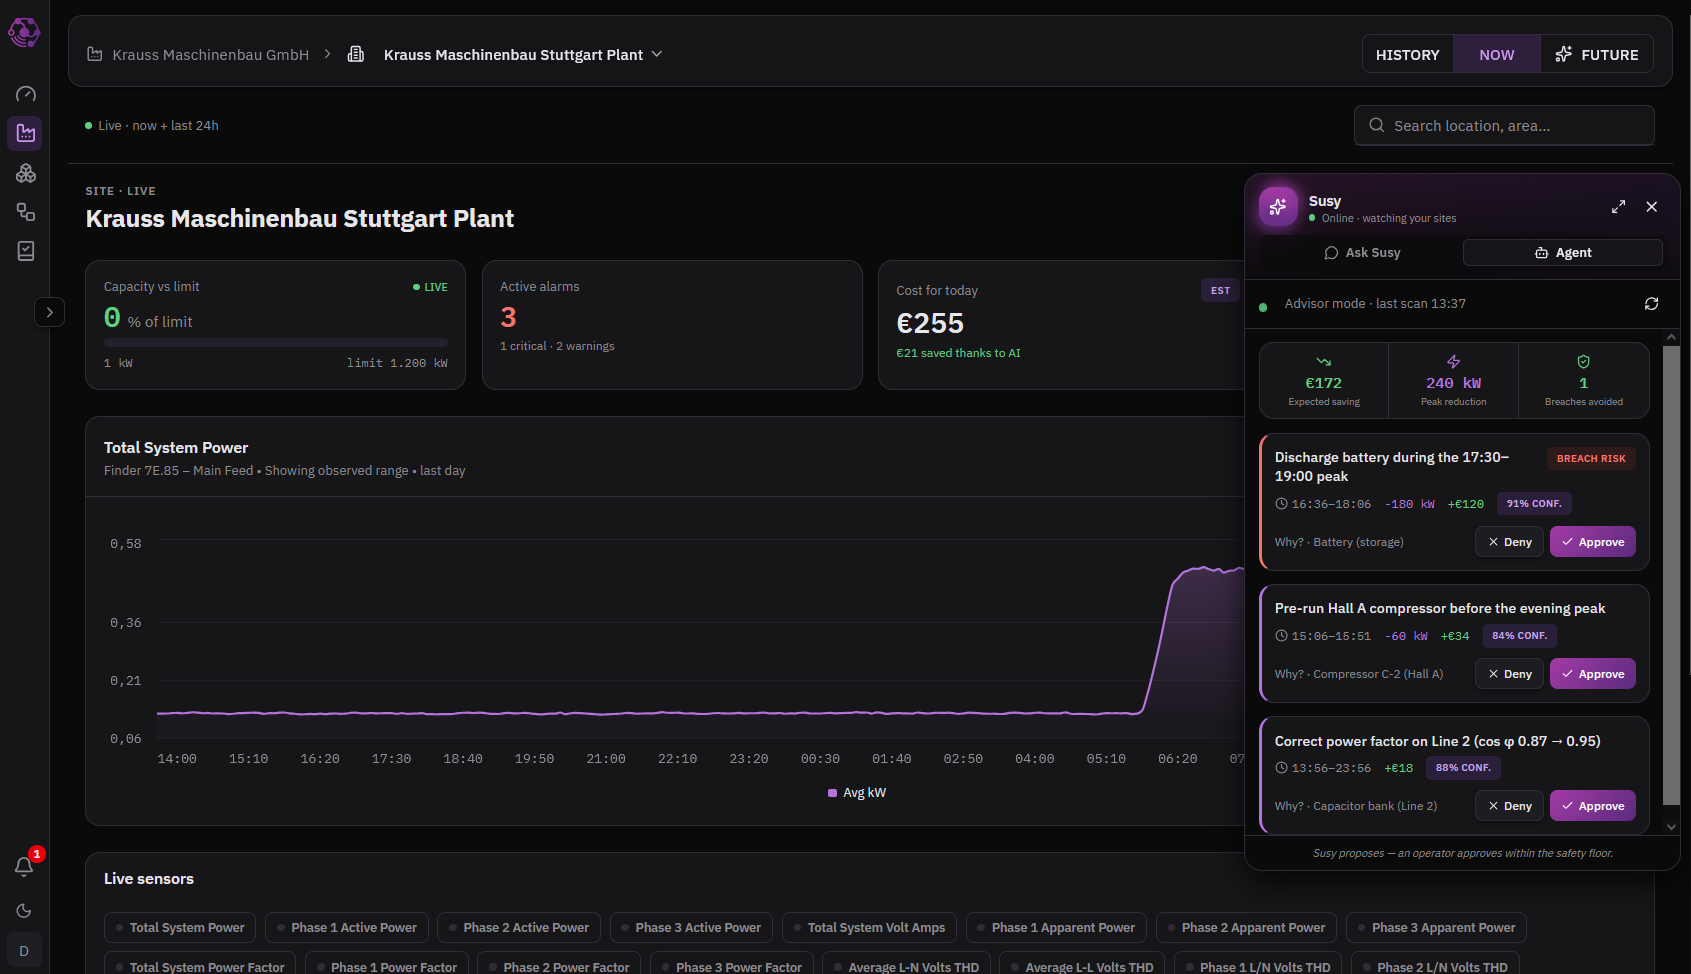
Your bill tells you the total. Not which line caused the peak.
Most factories know their monthly energy cost to the euro and their energy use per machine not at all. The main meter counts everything, the invoice arrives six weeks later, and the peak charge is a number nobody can explain. That is where the money leaks:
None of this needs new machines. It needs the main meter, sub-meters on the big consumers and software that turns the readings into decisions while the shift is still running.
Four things the system does, in the order you will use them
Measure first, understand next, then advise, then act. Every step is useful on its own, and every next step builds on the numbers of the previous one.
Two places to start
Most factories start with one of these two questions. Each has its own page with the details, the limits and the numbers behind it.
Honest about the numbers: what the system refuses to invent
An energy system is only worth something if you can trust its numbers in front of your finance director and your grid operator. So the software is built to say 'I don't know' rather than to fill a gap with a guess.
That shows up as a few hard rules:
You will see fewer numbers than in a glossy demo. The ones you see hold up in an audit.
- No authentic day-ahead price for tomorrow? Then there is no battery plan for tomorrow, never a made-up price.
- No meter reading fresher than two minutes? Then no charging and no live peak shaving. Only the already approved discharge plan continues.
- No capacity tariff configured for your site? Then a peak shows 'cost not estimated' instead of a fictional euro amount.
- A machine without its own meter gets its share of the parent meter, and every such number is flagged as an estimate.
- A ledger day with less than 90% of the battery samples stays an estimate, not a settled saving.
- Raw watts can never be commanded as kilowatts: units are verified before any hardware receives a command.
One set of numbers for production, finance and IT
Energy touches four people who normally each have their own spreadsheet. They now read the same measured data.
Works with the meters you have, and the battery you may get
You do not need to replace anything. The main meter is the first source. Where the picture per line or machine is missing, we add Finder energy meters on the main consumers: DIN rail, read in place.
A battery is not a requirement. Without one you get the full measuring, forecasting and advising layer, and peak protection by switching or shifting loads. With one, the system controls charge and discharge as well.
Like the rest of MeshOS, it runs the way your IT wants it to:
Control is opt-in per site: read-only, advisory with a person approving every action, or automatic within a safety floor you set.
- In the cloud on European servers.
- Hybrid, with local buffering on the edge device in the cabinet.
- Self-hosted on your own infrastructure.
Start with the main meter and your worst peak
You do not have to instrument the whole factory. The first useful number is the site's peak against the contract, and that needs one meter.
Step 1: we connect the main meter
An edge device reads the main feed and the meters you already have. Your contract limit and tariff go into the site profile.
Step 2: the first peak becomes visible
Within days you see the load curve against the limit, the peaks of the last weeks and which hours are the most expensive.
Step 3: sub-meters on the big consumers
Compressors, ovens, chillers, the lines that matter. Now cost per line, shift and product appears, and the forecast learns your real pattern.
Step 4: advise, then act
Recommendations start coming in with money on them. Once you trust them, connect the battery or a switchable load and let the system act within the limits you set.
Proof from the field
Energy data in practice
Real meters, real dashboards.
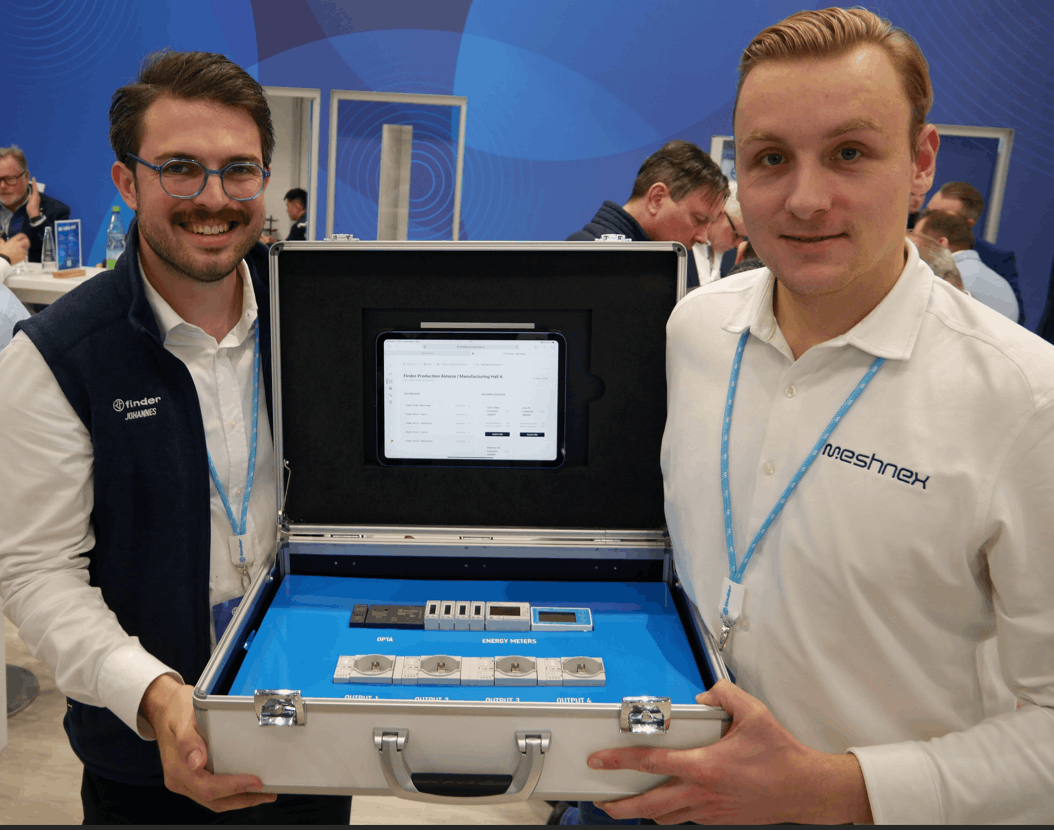 Energy monitoring
 Energy data that writes its own audit report
Sub-metering on the main consumers, one dashboard with kWh per line and per batch, and audit-ready ISO 50001 and CSRD reports generated from live data instead of a yearly spreadsheet scramble. The auditor's letter stopped being a fire drill.
Frequently asked questions about the energy management system
Do we need a battery to use this?
No. The measuring, forecasting and advising layer works without one, and peak protection can come from shifting or switching loads. A battery adds the closed-loop part: automatic charge and discharge on day-ahead prices and live peak shaving.
Will it control our machines?
Only if you switch that on. Every site starts read-only. Advisory mode means a person approves each action card. Automatic mode acts within a safety floor you set, and even then it never charges the battery unless a plan was approved.
How do you know what a peak costs us?
From your tariff. In the Netherlands the highest quarter-hour of the month is billed and an overrun raises your contracted level for the rest of the year. In Poland the ten largest quarter-hour overruns of the month are billed. If your tariff is not configured, the system says 'cost not estimated' rather than guessing.
How accurate is the forecast?
That depends on your history. The forecast combines four models and shows its own confidence band. Under seven days of real data it works on a synthetic profile and says so. After a few weeks of your own data the band tightens. The battery plan is also written to survive a wrong forecast: a peak reserve stays in the battery for risk hours.
Can we see cost per product?
Yes, if the machine or line is metered and production runs are known. Delivered cost (spot price plus network, capacity and tax components) is attributed per machine, shift, batch, product and order. A machine without its own meter gets a pro-rated share, flagged as an estimate.
Where do the prices come from?
From the ENTSO-E day-ahead market, converted to delivered prices with your supplier margin, network and tax components. No price for tomorrow means no plan for tomorrow.
Does this help with ISO 50001 or CSRD?
It gives you the measured basis: kWh per line and batch, logged continuously, with every estimate marked. The report itself still depends on your scope and auditor, but it stops being a yearly spreadsheet exercise.
Tell us your worst peak
Send us last month's bill and a picture of the main cabinet. We come back with what that peak cost, what a battery or a shifted job would have saved, and where the first meter goes.